How We Developed the SRD Index
The county-level SRD Index is based on a multidimensional framework of structural racism and discrimination. It captures interconnected systems shaped by a long history of racist and discriminatory policies.
These systems have perpetuated inequities, or “gaps,” between Black and White populations across multiple aspects of life.
Explore the SRD Index Model
Select any indicator, dimension, or the SRD Score to explore how the index is organized. Open the official methodology for complete data sources and calculations.
SRD Score
Five dimension Z scores are combined into the overall multidimensional SRD Index. Counties receive a national percentile score (0–100) and a within-state decile score (0–10).
Official documentation includes calculation methods, data sources, and score interpretation.
Each component links to the existing UConn Documentation pages. Indicator availability varies by reference year.
Methodology for SRD Index and Scores
- 16 Indicators or "gaps" are organized into 5 dimensions of SRD: residential segregation, housing, income, healthcare, and crime and incarceration.
- Indicators are calculated as a "ratio of rates" representing gaps between Black and White individuals.
- Outliers are adjusted by applying top and bottom coding to the values of each indicator before standardization. We used different percentile cutoffs depending on the distribution of each indicator ranging from 98.9th to 99.9th percentile for top coding and 1.1 to 0.1 percentile for the bottom coding.
- Indicators are converted to Z scores.
- The Z-scores for Racial Concentration, Primary Care, Mental Health Care, and Dental Health Care were reversed to align their directionality with the other indicators. All remaining indicators were not reversed.
- A dimension score (e.g., Housing) is calculated by taking the average of the Z scores of the indicators (e.g., Home Mortgage Loan Denial Gap and Home Ownership Gap) of a dimension.
- Dimension Z scores are converted to rank scores where a higher score indicates a higher impact of racism and discrimination for that dimension.
- 5 dimensions Z scores are added to calculate the multidimensional SRD Z score.
- The SRD Z scores are converted to rank scores where a higher score indicates a higher impact of SRD, all dimensions combined.
- Each county has a national SRD and a state SRD score.
- The national SRD score is a percentile rank of each county in the U.S. from 0 to 100.
- The state SRD score is a decile rank of each county of a state from 0 to 10.
- SRD scores are not calculated for counties with less than 100 Black individuals.
Formula for SRD Scores
- Calculate Indicator₁, Indicator₂, ..., Indicator₁₆ and adjust outliers
- Calculate Indicator₁, Indicator₂, ..., Indicator₁₆ to Z score₁, Z score₂, ..., Z score₁₆
- The Z-scores for Racial Concentration, Primary Care, Mental Health Care, and Dental Health Care were reversed to align their directionality with the other indicators. All remaining indicators were not reversed.
- Residential Segregation Z score = (Z₁ + Z₂) / 2
- Housing Z score = (Z₃ + Z₄) / 2
- Income Z score = (Z₅ + Z₆ + Z₇) / 3
- Healthcare Resources Z score = (Z₈ + Z₉ + Z₁₀ + Z₁₁) / 4
- Crime and Incarceration Z score = (Z₁₂ + Z₁₃ + Z₁₄ + Z₁₅ + Z₁₆) / 5
- SRD Z score = Sum of all 5 Z scores above (Segregation, Housing, Income, Healthcare, Crime)
- National SRD Score = Percentile rank of SRD Z score (0 to 100)
- State SRD Score = Decile rank of SRD Z score within state (0 to 10)
Interpretation for SRD Scores
Each county has a national and a state score.
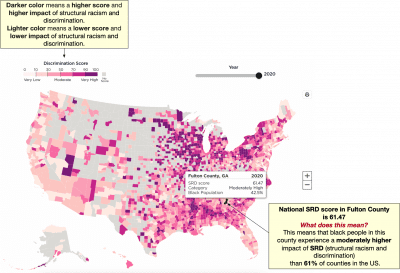
The national score is a percentile rank of each county in the U.S. from 0 to 100. A county with a higher score means Black people in this county experience higher impact of structural racism and discrimination compared to other counties. Use the national score to compare trends to other counties in the U.S.
See the explanation of national score for Fulton County below.
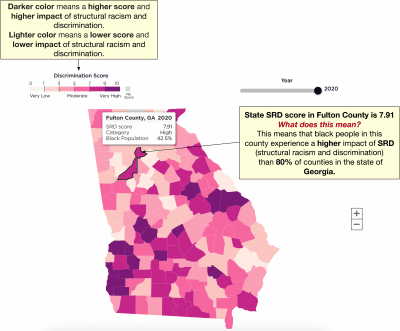
The state score is a decile rank of each county of a state from 0 to 10. A county with a higher score means Black people in this county experience higher impact of structural racism and discrimination compared to other counties in that state. Use the state score to compare trends to other counties in a state.
See the explanation of state score for Fulton County in Georgia below.